CSCI 261 - Programming Concepts (C++)Spring 2017 - Assignment 09 - Graph AliceQuick Links: Blackboard | Canvas | CS @ Mines | Cloud9 | Piazza | zyBooks |
|||||||||
| | Home | Contact | Syllabus | Assignments | Schedule | Resources | | |||||||||
|
This assignment is due
by Tuesday, April 3, 2017 11:59pm.
Concepts
This assignment will continue right where Assignment
08 left off. Recall that your solution to A08 wrote out to a file
the frequency of each letter in the Alice in Wonderland text. Well now
we are going to graph those frequencies in a much easier to read
format.
You will need to begin with the SFML Template once again and rename the project to be A09. Begin by reading in the contents of your letter frequency file into an array that stores the frequency of each letter. You should once again be using an array of size 26. Ready for the GUI part of your homework? Fasten your seat belt and
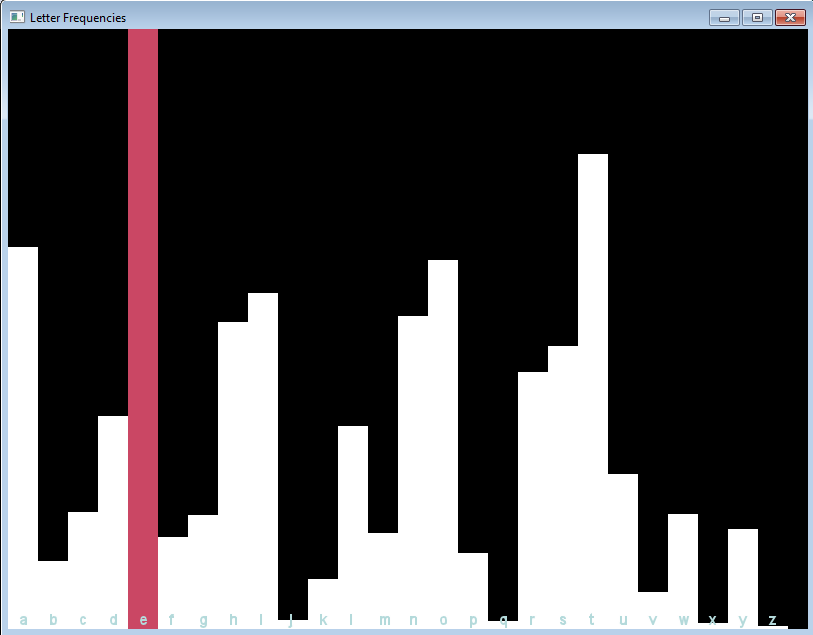
enjoy the ride! In this part you will draw a window that shows a bar
for each letter of the alphabet, with its height proportional to the
corresponding frequency. The bar that corresponds
to the most frequent letter should be painted with a different color. The bar that corresponds
to the least frequent letter should be painted with yet a third color.
Each bar is identified by its correspondent letter with a label at the
bottom.
Part I - Drawing the Bars
To draw the bars of the GUI you will use the RectangleShape
object called bar. For each letter you should draw a bar with a
height proportional to the letter frequency. All bars should have the
same width, can you guess what it is?
To set the bar's size you should use the object's setSize
function. In a similar way, to set the bar's position you should use
the object's setPosition function. The following example shows
how to change the size of the bar object using the values width=20
and height=100 AND the position of the bar object using the
values x=80 and y=250. Note that because you will be
drawing a bar for each letter using a loop, you should use variables
like width, height, x, and y to set the bar's properties accordingly.
bar.setSize(Vector2f((float)20, (float)100));
bar.setPosition(Vector2f((float)80, (float)250));
To set the bar's color you should use the setFillColor function.
Remember to set a different color to the bar that corresponds to the
most frequent letter. After setting the bar's size, position, and
color, you should draw the object on your window using the window's draw
function, illustrated in the code that follows.
bar.setFillColor(Color::White);
window.draw(bar); Part II - Drawing the Text Labels
To draw the text labels of the bars, you first need to load the
particular font you will use (we include
arial.ttf
in the data directory of the SFML template) and then use the Text
object (perhaps called text). To set the text's position you
should use the object's setPosition function in a similar way as
you did for the RectangleShape object. To set the text's label
you should use the object's setString function. This function
expects a string and what you have for each letter is a char.
The following snippet of code illustrates how to set the position of
the text object using the values x=80 and y=250 with a
text label based on character 'a' (assuming you have a charToString
function available). Finally, to actually draw the text object on your
window you should use the draw function.
text.setPosition(Vector2f((float)80, (float)250));
text.setString(charToString('a')); text.setColor(Color::Blue); window.draw(text);
The function charToString() is as simple as:
string charToString( char c ) {
    string s;
    s.push_back( c );
    return s;
}
Part III - Putting it All Together (hints, hints, hints...)
Use a loop to traverse your frequencies array. At
each iteration, draw a bar and a text label for the correspondent
letter. Let's say that you are using a variable named height to
compute the height of the 'to be drawn' bar. You can then use the
height of your window (i.e., a HEIGHT constant) divided by the
frequency of the most frequent letter as a scaling factor to compute
the height of each bar. After the bar's height is computed, determining
its y coordinate is a piece of cake: just subtract the
bar's height from the window HEIGHT.
Grading Rubric
Your submission will be graded according to the following rubric.
Submission
Always, always, ALWAYS update the
header comments at the top of your main.cpp file. And if you ever get
stuck, remember that there is LOTS of help
available.
In summary, for homework due on
Tuesday, April 3 follow these specific steps:
This assignment is due
by Tuesday, April 3, 2017 11:59pm.
| |||||||||
|
Last Updated: 01/01/70 00:00
|
|||||||||
